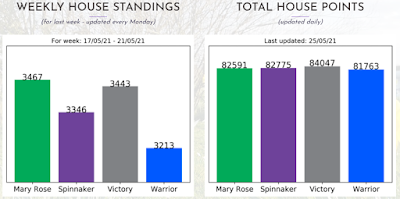
Automatically updated House Points chart
When I re-built the school website a couple of years ago, one of the things I wanted on the front page was a House Point tracker to help increase the friendly competition between Houses.
With that data to hand, I used BeautifulSoup to extract the data from the XML:
Every time a student gets positive points (e.g. Praise Points = 2 points, Star Student = 10 points) or negative points (for behavioural issues usually) they add or subtract from the House point total - for anyone unfamiliar with this, think Harry Potter!
As it turns out, this actually wasn't too difficult to do, although it did involve me learning a LOT more about Python and the power of packages!
The raw data export was fairly simple. Like a lot of schools in the UK, we use SIMS as our Student Information System. We also use a web front-end for it, called PARS, initially because it added a lot that SIMS didn't do back then, such as attendance and behavioural tracking.
Luckily, PARS has some really nice custom reporting and automation modules. This meant I could easily set up a report to run at 4am each day to give me the data I needed in an XML format.
houseFilePath = "[redacted]/DisplaysTotalHousePoints.xml"
with open(houseFilePath) as houseFile:
    houseData = BeautifulSoup(houseFile, "xml")
    houses=[]
    points=[]
    for main in houseData.NewDataSet.findAll("MAIN"):
        houses.append(main.House.get_text())
        points.append(int(main.Total.get_text()))
Then it was just a case of learning to use matplotlib to create the actual charts from the data and save them as a .png file:
y_pos = np.arange(len(houses))
barlist = plt.bar(y_pos, points, align='center', alpha=1)
for a,b in zip(y_pos, points):
    plt.text(a, b+500, str(b),horizontalalignment='center',fontsize='16', color='black')
plt.xticks(y_pos, houses, fontsize='14')
plt.yticks([])
low = min(points)
high = max(points)+15000
plt.ylim([0, high])
plt.title("Last updated: " + today.strftime('%d/%m/%y'))
barlist[0].set_color('#01aa59')
barlist[1].set_color('#6e429a')
barlist[2].set_color('#808285')
barlist[3].set_color('#0059ff')
plt.savefig('[redacted]/housepoints/DisplaysTotalHousePoints.png', facecolor="white", transparent=True, dpi=300, bbox_inches='tight')
plt.clf()
Finally, I had to upload the png files to the webserver to replace the last image:
host = [redacted]
port = [redacted]
transport = paramiko.Transport((host, port))

password = encodedPwd
username = [redacted]

transport.connect(username = username, password = password)

sftp = paramiko.SFTPClient.from_transport(transport)

path = '/[redacted]/housePoints/DisplaysTotalHousePoints.png'
localpath = '[redacted]/housepoints/DisplaysTotalHousePoints.png'
sftp.put(localpath, path)

sftp.close()
transport.close()

Comments
Post a Comment